Xcaret Weather, Month by Month
Hours, prices and access verified by the Xcaret Tours team — last checked 2026-09-22.
The park is outdoors, most of it is water, and the month you come decides
how the day feels rather than whether it happens. The figures below are the official Mexican
record for the nearest station. If you are weighing a month against a fare, the
xcaret ticket prices are compared elsewhere.
What the weather does to a day here
Heat is the constraint, not rain. From May to September the middle of the day is hot and
humid enough that travellers ask the park for misters, and the water is where you want to be
between noon and four. One reviewer's only complaint about a September visit was the
humidity; another pointed out that the water-bottle refill stations are not chilled.
Rain rarely ends a day, but it can close attractions: a traveller who came on a wet day
found half of them shut by the afternoon. The rivers run whatever the sky does, and the
theatre is covered. What no month changes is the clock — the rivers close at
5:30 p.m. in every one of them, so a short winter afternoon costs you river time that
a long summer one does not.
The figures below come from CONAGUA station 23163, Playa del Carmen, whose record runs from 1998 to 2026. The
station sits in the town, about 10 km north of the gate, so read it as the local climate
rather than as a reading taken inside the park.
Xcaret month by month
Xcaret weather in January
Highs average 28 °C and lows 19 °C, for a monthly mean of 24 °C. About 77 mm of rain falls. The coolest month of the year and one of the driest, with the lowest average high on the record. Evenings after the show are the one time you will want a layer.
Xcaret weather in February
Highs average 29 °C and lows 20 °C, for a monthly mean of 24 °C. About 52 mm of rain falls. Dry, warm and comfortable, with rain at its second-lowest. If you want the rivers and the walking without the afternoon heat, this is the month.
Xcaret weather in March
Highs average 30 °C and lows 20 °C, for a monthly mean of 25 °C. About 35 mm of rain falls. The driest month on the record by a clear margin, and still short of the summer heat. If you get to choose your month, this is the one to spend walking the routes from opening to the show.
Xcaret weather in April
Highs average 32 °C and lows 22 °C, for a monthly mean of 27 °C. About 41 mm of rain falls. Warmer, still dry, and the last month before the wet season turns on. Shade and water start to shape how you order your day, so take the rivers early.
Xcaret weather in May
Highs average 32 °C and lows 24 °C, for a monthly mean of 28 °C. About 80 mm of rain falls. Heat and rain both climb. The indoor hours — the aquarium, the pavilions — start earning their place, and you will want them by mid-afternoon.
Xcaret weather in June
Highs average 32 °C and lows 24 °C, for a monthly mean of 28 °C. About 200 mm of rain falls. The wet season opens hard, with rainfall jumping past 200 mm, and the Atlantic hurricane season starts on the first. Storms usually come in the afternoon, so your morning is the reliable half.
Xcaret weather in July
Highs average 33 °C and lows 24 °C, for a monthly mean of 28 °C. About 88 mm of rain falls. Hot and wet, with the year's highest average low: the nights stop cooling. The water is the only comfortable place to be between noon and four, so plan to be in it.
Xcaret weather in August
Highs average 33 °C and lows 24 °C, for a monthly mean of 29 °C. About 114 mm of rain falls. The hottest month on the record. Travellers in the late-summer heat ask for misters and cold water, and the refill stations are not chilled.
Xcaret weather in September
Highs average 33 °C and lows 24 °C, for a monthly mean of 28 °C. About 173 mm of rain falls. Still hot, wetter again, and deep in the hurricane season. A traveller who came in September called the day too hot and humid, and meant it kindly.
Xcaret weather in October
Highs average 32 °C and lows 22 °C, for a monthly mean of 27 °C. About 290 mm of rain falls. The wettest month of the year by a wide margin, and the month the Day of the Dead festival lands in. Heavy days are heavy, so pack for rain and go anyway — you came for water.
Xcaret weather in November
Highs average 30 °C and lows 20 °C, for a monthly mean of 25 °C. About 160 mm of rain falls. The rain drops away sharply and the heat goes with it. The hurricane season ends on the last day of the month, and you will have the routes to yourself before the holidays fill them.
Xcaret weather in December
Highs average 29 °C and lows 19 °C, for a monthly mean of 24 °C. About 89 mm of rain falls. Cooler, drier and busy with the holidays. Dark comes early, which costs you nothing at the theatre and everything in the river, so book your day early and start it early.
The seasons, and which one you want
| Season | Average high | Average low | Rain a month | Heaviest day |
|---|
| Winter: December to February | 29 °C | 19 °C | About 73 mm | About 32 mm |
| Spring: March to May | 31 °C | 22 °C | About 52 mm | About 26 mm |
| Summer: June to August | 33 °C | 24 °C | About 134 mm | About 48 mm |
| Autumn: September to November | 31 °C | 22 °C | About 208 mm | About 65 mm |
Spring, March to May, is the stretch to aim for if you can choose. March is the driest
month on the record and the heat has not yet arrived, which makes it the best single month
for a long day on foot. February and April sit either side of it and will serve you nearly
as well.
Autumn is the wettest season and October is the reason: it carries far more rain than any
other month, and the Day of the Dead festival lands inside it. That is not an argument
against going. It is an argument for packing a jacket and holding a fare you can move.
Summer is the hottest of the four and the water is the answer to it. Winter is the
coolest, and the second-driest after spring — the one time of year you may want
something warm for the two hours of the evening performance in the open theatre.
Picked your month?
The fares run the same way all year: entry alone, a coach day, or two parks over two days. Compare what each one covers.
The best time of day, in any month
Arrive at 8:30 if you can, and go to the water first. That single decision is worth more
than the month you pick: the rivers close at 5:30 p.m., the crowds build through the
middle of the day, and the animal houses and the theatre are the parts that keep working into
the evening. Travellers who enjoyed the day most all describe doing it in that order.
In the hot months, treat the aquarium and the butterfly pavilion as your afternoon shade
rather than as morning sightseeing. In the cool ones, take a layer for the show — it
runs two hours after dark in an open theatre.
What to pack for the weather
- Reef-safe sunscreen and a hat, in every month.
- Water shoes or old trainers. The river floor is sharp, and sliders are
turned away at the water.
- A light rain jacket, especially June to November.
- Something warm for the evening, December to February.
- A refillable bottle. The stations are free and not cold.
- Insect repellent for the jungle trail and after dark.
Asked about the weather here
What is the best time of year to visit Xcaret?
March is the driest month on the nearest official record and October by far the wettest, with nearly 290 mm. June to November is the Atlantic hurricane season, and the same stretch carries the warmest, wettest weeks. If rain would spoil it for you, aim for February to April.
What is the wettest month at Xcaret?
October, with about 290 mm on the nearest official record — well over half as much again as September, the next wettest. It is also when the Day of the Dead festival runs.
What is the driest month?
March, at roughly 35 mm, with highs averaging 30 °C. February and April are close behind it. Those three months are the comfortable stretch for a long day on foot.
Does rain close the park?
The park stays open, but individual attractions can shut on a bad day: one traveller found half of them closed after heavy rain. The rivers and the theatre are the least affected. Hold a fare you can move rather than one you cannot.
Is there a hurricane season?
Yes, the Atlantic season runs from June to the end of November, and it overlaps the warmest and wettest weeks of the year here. Most days in it are fine. Travel insurance and a refundable fare are the sensible precautions.
Where these figures come from
Every temperature and rainfall figure above is the long-run monthly mean published by the
Servicio Meteorológico Nacional for CONAGUA station 23163, Playa del Carmen, from the statistics file issued on 18
September 2026, covering 1998 to 2026. The heaviest-day column is that record's mean maximum
fall in 24 hours. Hurricane-season dates are the standard Atlantic season. Where a traveller
is quoted, the words come from a review left on one of the listings here.
Water days, shade days, and one that runs underground

A catamaran day to the island opposite, with the ferry both ways, snorkelling gear, lunch and drinks. It does not enter the park, and port taxes are paid on the day.
From $195 per person
Check Availability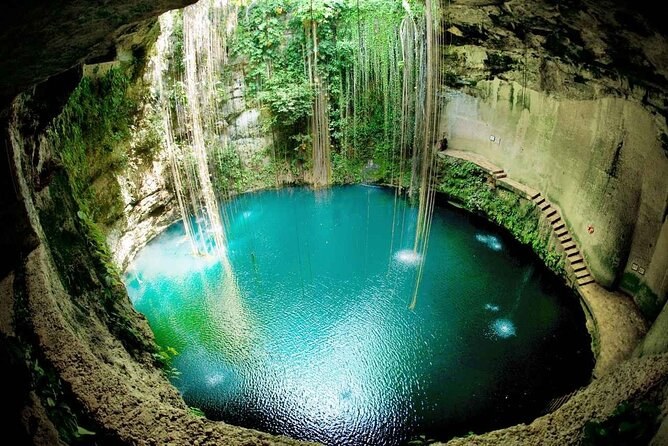
Four cenotes rather than the park: a rappel into a cave, ziplines, kayaking and a picnic, with a certified guide. This one is not refundable.
From $250 per person
Check Availability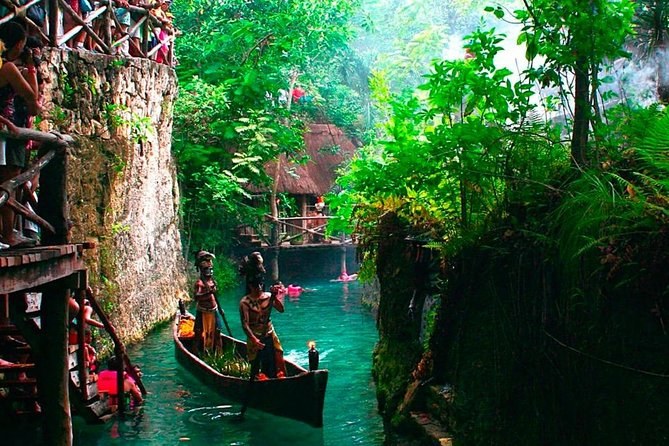
A full day out of Cancún or the coast, with hotel pickup, one meal at a park restaurant with a soft drink, and the children's water park.
From $268 per person
Check Availability